Kaspa Just Connected to Ethereum – Live EVM Bridge Brings Stablecoins and DeFi to KAS
Kaspa has gained a live connection to the broader crypto ecosystem. A community member broke down the infrastructure on X. Igra Labs runs an EVM‑compatible Layer 2 anchored to Kaspa.
Hyperlane connects that environment to other EVM chains. Applications like Kaspa.com and ZealousSwap are building on top, and Kaspa KAT moves value between L1 and L2.
This is not a testnet promise. It is live infrastructure supporting real activity. Stablecoins can now bridge into the Igra L2 and be used immediately. Builders can use familiar EVM tools while settling on Kaspa. The network is no longer isolated.
How the Bridge Works – Live and Already in Use
The community member explains the flow: KAS can move to Igra (as iKAS) and then to EVM networks. Kaspa and ZealousSwap have launched a USDC <> KAS L2 pool. Stablecoins can enter the Kaspa ecosystem through this route. K.A.T. enables movement between Kaspa L1 and L2.
This is ecosystem‑driven development around the Kaspa base layer. Kaspa Core advances real‑time settlement at the base. Igra extends that capability through an EVM‑compatible L2. Hyperlane enables cross‑chain connectivity. Applications and liquidity are already functioning.

Source: X/@Kaspa_Commons
What This Means for Kaspa's Ecosystem
The community member lays out the "So what." Stablecoin liquidity can now enter and move through the Kaspa ecosystem. Builders can use familiar EVM tools while anchoring to Kaspa. Applications, trading, and asset movement are already functioning – not theoretical.
"How this comes together" is a layered stack. Kaspa Core provides real‑time settlement at the base layer. Igra extends that capability through an EVM‑compatible L2. Hyperlane enables cross‑chain connectivity. Kaspa.com and ZealousSwap bring applications and liquidity. K.A.T. keeps value moving between L1 and L2.
"Where this is heading" is the most important part for long‑term believers. This is a working model built with today's tools. As Kaspa evolves with covenants and KvProgs through Toccata, builders across this ecosystem may begin moving more logic, assets, and coordination directly onto Kaspa L1. The roles of L2s, bridges, and integrations can evolve alongside that shift, as more capability becomes native to the network.
We broke down the full Kaspa Toccata hard fork timeline and its implications in our previous analysis.
"The bigger picture" is simple. Kaspa is becoming a system that connects, routes, and settles. This is one working example. Many teams across the Kaspa ecosystem are building in parallel, shaping how this network is used in practice.
KAS Price Analysis – Still Trapped Below Key Levels
The 4‑hour KAS/USDT chart on MEXC shows a token under pressure. The KAS price trades at $0.034688, down 1.5% today. The 200‑day moving average sits at $0.043567 – a full 25% above current price. KAS has been below the 200‑day MA for weeks, a classic bearish signal.
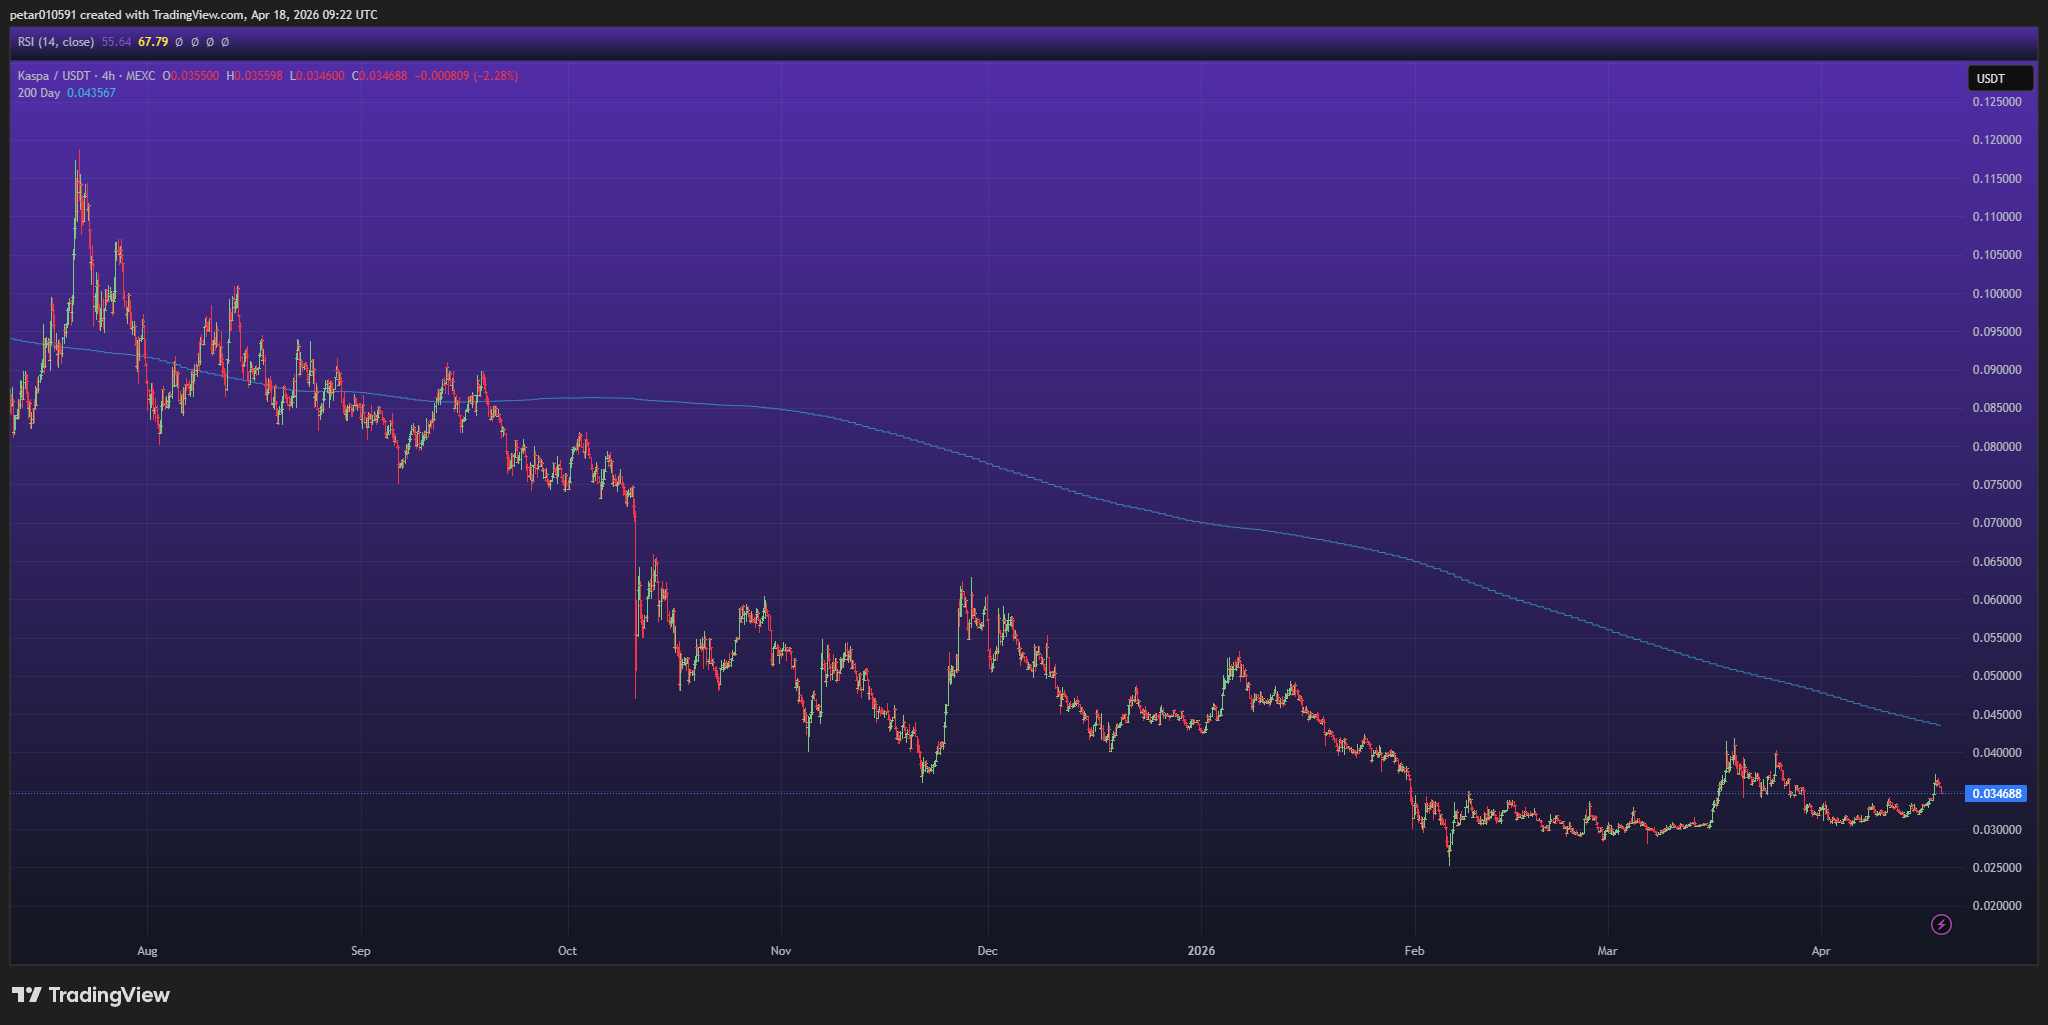
Source: TradingView
Resistance sits at $0.036, then $0.040. Support is at $0.034, then $0.032. The RSI (14) is at 55.64 – neutral, not oversold. The faster RSI at 67.79 is approaching overbought territory on shorter timeframes.
Despite the weak price action, long‑term holder supply hit an all‑time high of 46% of circulating supply – a signal we covered in our Kaspa supply shock analysis.
The bridge news is bullish for the long‑term utility of Kaspa. But price has not reacted yet. The token remains in a downtrend. Until KAS breaks above $0.040 and the 200‑day MA, the chart remains bearish. The bridge is a step forward, but the market is still waiting for proof of usage and demand.
Frequently Asked Questions
1. Is Kaspa quantum resistant?
Not yet. The network has a comprehensive four-phase plan for post-quantum cryptography to defend against future quantum computers, starting with wallet-layer improvements that hide public keys until coins are spent.
2. Why is Kaspa down?
Kaspa is caught in a broad altcoin bear market. The KAS chart has shown a pattern of lower highs and lower lows for over a year. Key technical indicators remain bearish with the price stuck below its 200-day and 50-week moving averages.
Related Articles
XRP monthly RSI has dropped to a deep oversold zone – only the 4th time in 13 years. Previous three resets marked major
Solana vote batching dropped validator breakeven from 7,200 SOL to 929 SOL – an 87% reduction. Small validators went fro
Strategy just deposited 411 BTC into Coinbase Prime. Polymarket odds of MicroStrategy selling BTC by Dec 31 just hit 84%
Bitcoin plunged below $73K while Ethereum lost the key $2,000 level as rising U.S.-Iran tensions triggered panic across