Kaspa Price Warning: Funding Turns Positive, But a Flush Could Reset Positioning
Kaspa funding rates just flipped positive. The current daily average sits at 0.0255%. On the surface, that sounds bullish – longs are willing to pay shorts to keep their positions. But Kaspa Daily, the community account that posted the chart, pointed out a more nuanced pattern. Over the past six months, red negative funding prints clustered around local lows, while green positive funding dominated the rest of the time.
Yet the KAS price has not broken out. This is exactly what we explained in our Kaspa price prediction for this week.
Longs are paying to hold a thesis that spot Kaspa price is not confirming. That is a warning.
The key insight from the funding chart is this: when positive funding persists but price does not rise, it suggests absorption or distribution. Overcrowded longs become fuel for a flush. And history shows that negative funding spikes – not positive ones – have marked the actual lows.
Funding Analysis – Positive Doesn't Mean Bullish
Funding rates measure positioning imbalance. Negative funding means shorts are crowded and paying longs. Positive funding means longs are crowded and paying shorts. Right now, funding is positive at 0.0255% daily. Traders are long and willing to pay to stay that way. That is conviction, but it is also overcrowding risk.
Kaspa Daily noted that red prints cluster around local lows while green dominates everything else. The interpretation is not that positive funding is bullish. Instead, it shows the market is structurally long‑biased. Longs keep paying, but spot price has not confirmed the thesis with a sustained uptrend. That means buyers are absorbing supply without pushing price higher – a potential sign of distribution.

The most important line from the tweet is: "Longs pay to hold a thesis spot isn't confirming." That is the edge. When funding is positive and price stalls, it often precedes a flush. Overcrowded longs get squeezed out, positioning resets, and then price can finally bottom. February and March demonstrated this pattern: negative funding spikes marked the actual lows after a flush cleared the crowded side.
What Happened in February and March – The Flush Pattern
Kaspa Daily pointed to February and March as textbook examples. During those months, negative funding spikes marked the actual lows. Extreme negative funding means shorts were panicking and overcrowded. The market became overly bearish. That capitulation led to a reversal and a squeeze higher.
In contrast, positive funding periods did not mark bottoms. They marked stretches of sideways or slightly up price action, but the real turning points came after a flush that cleared out the crowded longs. The pattern is consistent: red prints cluster around lows because that is when shorts get squeezed or longs get liquidated. Once positioning resets, price can move.
The current setup has funding positive at 0.0255% daily, but spot Kaspa price has not confirmed a breakout. The 6‑month chart shows a similar pattern to periods before previous flushes. Either a spot bid arrives to validate the longs, or – more likely – another flush will clear them out again.
Related analysis: Kaspa Holders Breakdown and on-chain analysis.
Kaspa Chart Analysis & Price Prediction – Weak Structure, Lower Highs
The price chart (from CryptoCompare) shows a clear structure: downtrend → base → breakout → then a lower high. Price spiked to roughly $0.037, but that move was rejected hard and not sustained. Since that rejection, Kaspa has been drifting down, forming lower highs, with slow bleeding and no strong demand. The chart is losing momentum without any expansion.
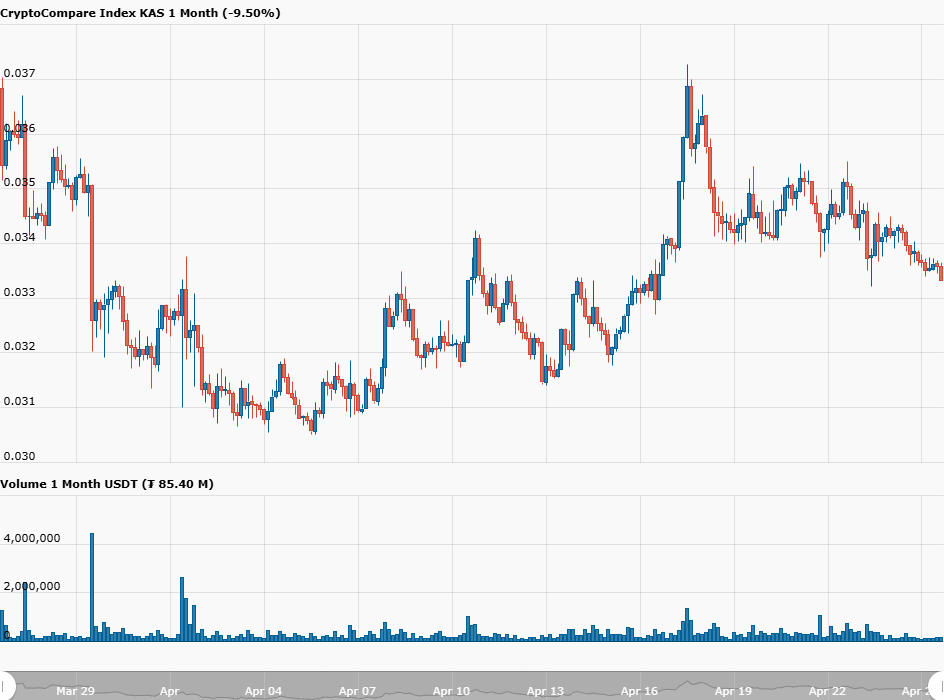
Key observation: the rejection at $0.037 was the turning point. After that, price has consistently made lower highs while support near $0.033‑$0.034 has been tested multiple times. There is no sign of aggressive buying. Combined with positive funding, this setup is bearish pressure building.
Short‑term price projection (next move): The most likely path is a sweep of liquidity below the recent lows – down to the $0.029‑$0.030 zone. That would flush out crowded longs, cause funding to flip negative, and then set up a bounce. If that squeeze happens, the bounce target would be back to $0.033‑$0.035. If breakdown accelerates, the next downside zone is $0.027.
Key levels to watch: Resistance sits at $0.0345‑$0.036. Support is at $0.029‑$0.030, with deeper support at $0.027. The chart needs either a spot bid (real demand) to reclaim $0.035‑$0.036, or a flush to reset positioning. Without those, Kaspa remains in a weak drift.
Read also Kaspa just connected to Ethereum.
Wrap‑Up – What to Watch for Kaspa Price
Kaspa funding has turned positive, but that is not an automatic buy signal. The market is structurally long‑biased, and spot price is not confirming the thesis. The price chart shows lower highs, a rejected breakout, and no strong demand. History from February and March shows that negative funding spikes – not positive ones – marked the actual lows.
The most likely path is a flush to $0.029‑$0.030, clearing out crowded longs, then a bounce. Until that happens, the bias remains bearish.
Frequently Asked Questions
1. Does Kaspa Coin have a future?
Yes – Kaspa’s unique BlockDAG and GHOSTDAG architecture already processes over 10,000 transactions per second, far outpacing Bitcoin . The Toccata hard fork (June 2026) will add programmability, enabling DeFi and token issuance, while the nearly fully mined supply (95.4% already in circulation) means no heavy unlock schedules suppress the price .
2. Can Kaspa reach $5 dollars?
Extremely unlikely. A $5 KAS would give it a market cap of roughly $118–$132 billion – comparable to Ethereum’s 2023 valuation . Most price models place Kaspa at $0.35–$0.38 by 2030 , and a $5 price would require a perfect storm of mass user adoption and regulatory clarity, with odds estimated well below 3% .
Related Articles
Zcash (ZEC) surged after Robinhood listed the privacy coin on April 23, which brings it to millions of retail investors.
Software engineer Vincent van Code ran a deep LLM study using Grok AI, factoring in Ripple's acquisitions, the CLARITY A
On the daily Shiba Inu chart, price has broken out of a long-term downtrend and is now retesting that level; this is whe
ADA is up 2.5% today, trading at $0.2547, mostly in line with Bitcoin and Ethereum. The next level to break is $0.26. Bu