Where Is Shiba Inu Price Headed as a 100% $SHIB Move Comes Into Focus?
Shiba Inu (SHIB) is starting to look interesting again, but not in an obvious, hype-driven way. Right now, the price is sitting at a critical level where the next move could shape the trend for weeks or even months. While the lower timeframes still look messy and indecisive, the bigger picture is slowly improving.
What we’re seeing is a classic situation in crypto today: after a long period of decline, the market is trying to turn around, but it hasn’t fully committed yet. This phase is usually where patience matters most, because the real move doesn’t start until the structure confirms.
The Breakout Chart Everyone Is Watching
A recent chart shared by the CryptoBasic on X shows SHIB could move up to 100% from here, but only if one key condition is met. The chart shows that SHIB has finally broken out of a long-term downward channel and is now coming back to test that breakout level.
This kind of “breakout and retest” is one of the most important patterns in technical analysis. When price breaks above a long-term resistance and then comes back to test it, that level needs to hold. If it does, it often becomes a strong support and confirms a shift in trend.

Source: X/@thecryptobasic
That’s exactly where SHIB is right now. Price is sitting on that former resistance line, trying to turn it into support. If buyers step in here and we start seeing higher lows on the daily chart, that would be a strong sign that the downtrend is over. But if price drops back below the channel, then the breakout likely failed.
Looking ahead, there are two important resistance zones. The first sits around $0.0000078 to $0.0000082, and the second, much stronger one, is between $0.0000103 and $0.0000126. These levels come from previous areas where sellers took control, so they won’t break easily. Even if SHIB starts moving up, it will probably slow down or react at these zones.
The idea of a 100% move isn’t unrealistic, but it’s not guaranteed either. For that to happen, we’d need to see strong volume, likely the return of the bull run, and indicators like MACD and RSI turning more decisively bullish. Without that, price could just grind slowly or get rejected along the way.
Read also: Where is ADA Price Headed After Cardano TVL Fails to Bounce
Shiba Inu News: Utility Expansion Meets Mixed Whale Signals
Beyond technicals, SHIB’s long-term outlook continues to be shaped by its evolving ecosystem. The project is actively transitioning beyond its meme coin origins, with Shibarium, its layer-2 network, playing a central role. A major upcoming development includes a privacy upgrade using Fully Homomorphic Encryption (FHE), expected in Q2 2026. This, along with initiatives like the Shib Alpha Layer (L3 rollup stack) and partnerships in AI and Web3 gaming, aims to introduce real utility while supporting token burn mechanisms.
On-chain activity, however, presents a mixed picture. Large holders (whales) have accumulated approximately 2.02 trillion SHIB tokens, signaling strong conviction from some segments of the market. At the same time, notable long-term holder DJ Steve Aoki has reportedly exited his entire SHIB position after nearly five years. This divergence shows the current uncertainty; where some investors are positioning for growth, while others are locking in exits.
SHIB Chart Analysis and Price Predictions
From a lower timeframe (2H) perspective, the market tells an interesting story; one of compression rather than trend. Price has transitioned from a clear downtrend into a sideways accumulation range between approximately $0.0000055 and $0.0000066. This type of structure often precedes a breakout but offers little directional clarity in the moment.
Indicators reflect this indecision. The SuperTrend is flipping frequently between buy and sell signals, making it unreliable for trend-following strategies and better suited for short-term scalping. Even though it has recently turned green, which indicates a mild bullish bias, price has already encountered resistance which basically means that momentum remains weak.
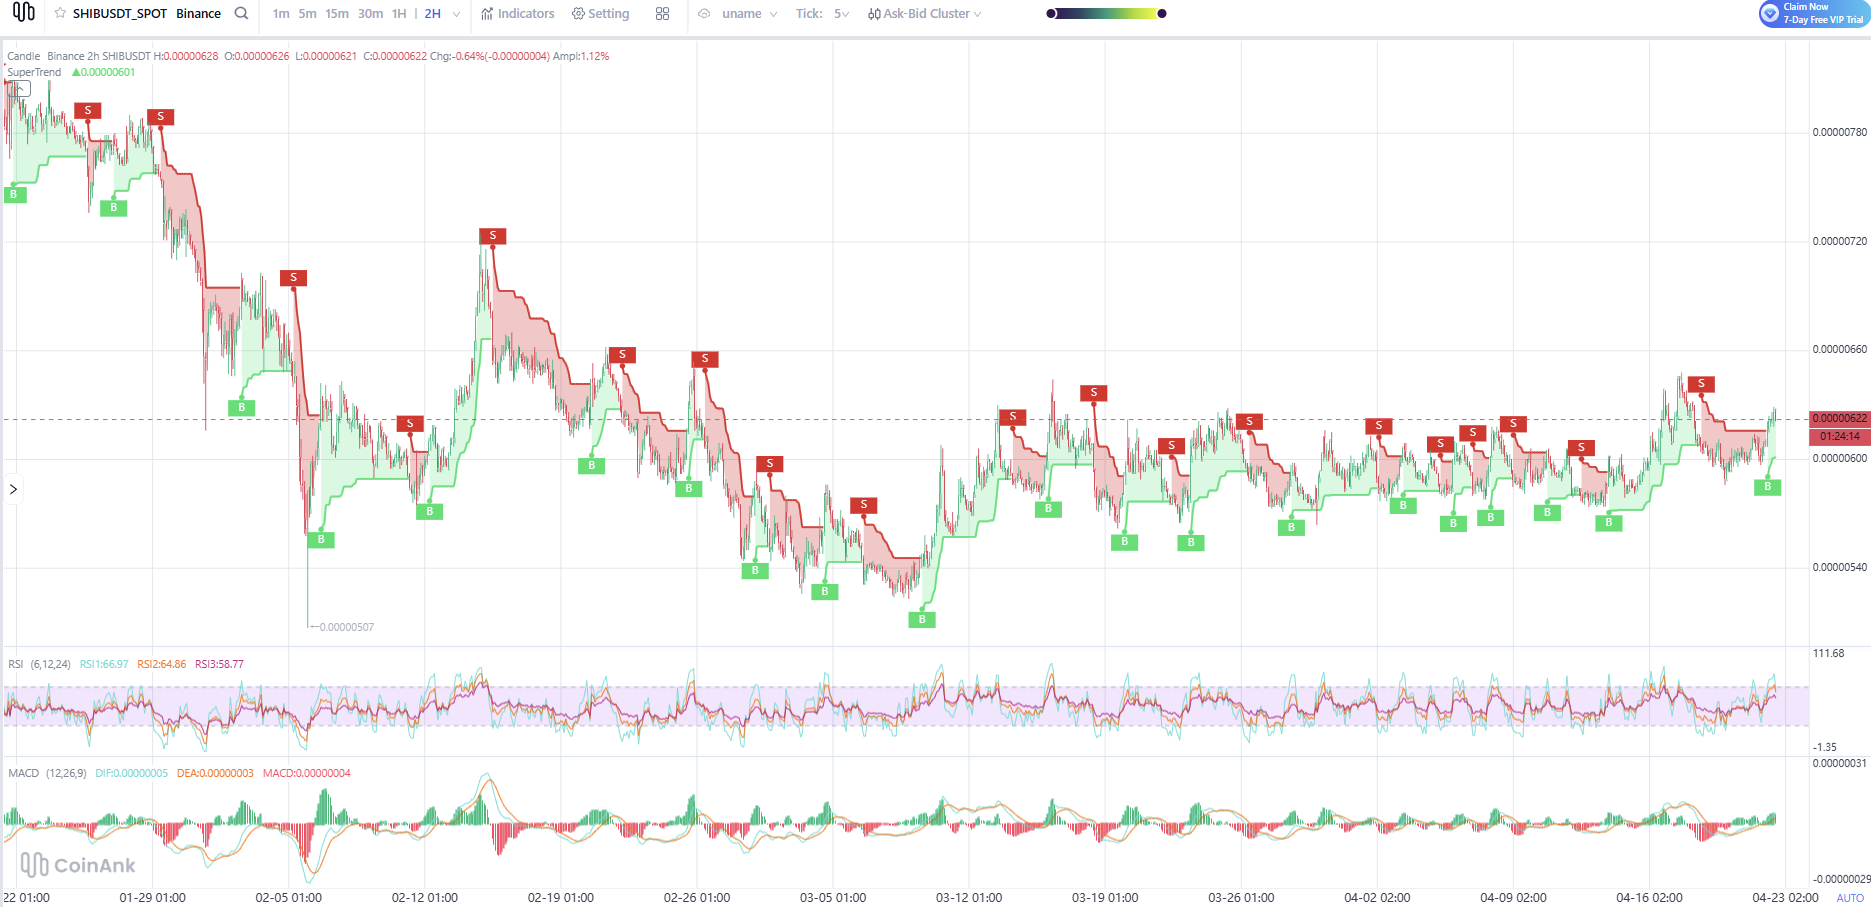
Source: CoinAnk
The MACD further confirms this lack of conviction. Histogram bars are small and alternating, and the signal lines are crossing frequently; classic signs of a market with no dominant trend. For a meaningful move to develop, traders would need to see expanding histogram bars and clear separation between MACD lines, signaling momentum buildup.
Similarly, the RSI (6, 12, 24) remains in a neutral range between 40 and 60, showing neither overbought nor oversold conditions. There is a slight upward tilt, hinting at building bullish pressure, but nothing strong enough to confirm a breakout yet.
What’s unfolding here is a typical accumulation phase. Liquidity is building, both buyers and sellers are getting trapped, and indicators appear messy because the market is coiling for a larger move. The key levels to watch remain clear: resistance at $0.0000063–$0.0000066 and support at $0.0000055–$0.0000058.
In practical terms, SHIB is ranging. A confirmed breakout above resistance, supported by SuperTrend alignment and MACD expansion, would likely trigger a momentum move. Conversely, another rejection could send price back toward range lows.
For now, the market remains in a wait-and-react phase, with traders either scalping the range or waiting for confirmation of a larger breakout.
Frequently Asked Questions
1. Is Shiba Inu dead?
No, definitely not. SHIB is still actively traded and developing, with ongoing ecosystem upgrades and strong community interest, even though price action has been slow.
2. Does Shiba Inu have a future?
Yes, but it depends on many factors; projects like Shibarium and utility expansion could support long-term growth if they produce real results. The return of the meme coin season would also be a strong sign SHIB will do good.
Related Articles
CryptoPatel’s monthly chart shows XLM setting up for a historic breakout. His target range sits at $5 to $10, driven by
Doctor Profit says his short zone at 79‑82k worked perfectly while the crowd longed above 80k. Remaining shorts at 83‑85
More Crypto Online says XRP remains in a holding pattern with no sign a local low has formed. Key levels: resistance $1.
CryptoPatel says DOGE is printing the exact same fractal that delivered 26,834% in the last cycle. Breakout 1 and 2 alre